Menu

Google Ads Regression algorithm
1. Project Overview
- This project involved the creation of a hypothetical yet coherent dataset comprising 500 Google Ads campaigns, focusing on critical performance metrics essential for understanding campaign effectiveness.
2. Key Metrics
The dataset includes:
- Campaign Name: Identifier for each campaign.
- Clicks: Total number of clicks on the ads.
- Impressions: Total number of times the ads were displayed.
- CPC (Cost Per Click): Average cost incurred for each click.
- CTR (Click-Through Rate): Percentage of impressions that resulted in clicks.
- Conversions: Total number of conversions attributed to the campaigns.
- Conversion Rate (CVR): Percentage of clicks that resulted in conversions.
3. Data Preparation
Using Python, the dataset underwent extensive preprocessing to ensure high quality and reliability:
- Data Type Transformation: Correct formatting for analysis compatibility.
- Data Cleaning: Removal of null values, duplicates, and extra spaces.
- Outlier Removal: Statistical methods were used to identify and eliminate outliers.
- Data Normalization: Standardization techniques were applied to enhance modeling effectiveness.
4. Statistical Analysis and Visualization
- A series of statistical analyses explored relationships among variables, complemented by visualizations that clearly presented findings. Notable visualizations included:
- Scatter Plots: To show the correlation between CPC and predicted conversions.
- Histograms: To analyze the distribution of clicks and impressions.
- Box Plots: To identify variations and outliers in campaign performance metrics.
5. Predictive Modeling
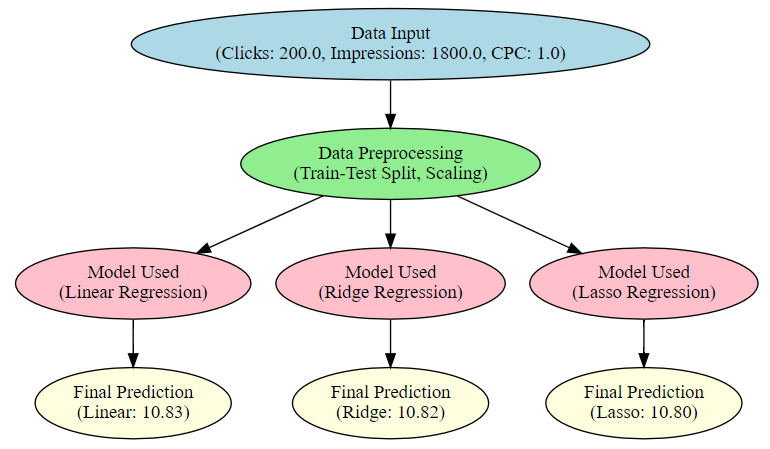
The primary objective of this analysis was to accurately predict the number of conversions for each campaign based on clicks, impressions, and CPC. Multiple regression techniques were applied, including:
- Multiple Linear Regression
- Ridge Regression
- Lasso Regression
The effectiveness of these models was measured by their R² scores:
- Multiple Linear Regression: R² Score of 69.45%
- Ridge Regression: R² Score of 69.45%
- Lasso Regression: R² Score of 69.43%
These scores indicate a strong relationship between the independent variables and the predicted conversions, demonstrating the models’ capability to forecast campaign performance accurately.
6. Conclusion
- This analysis emphasizes the significant impact of data-driven decision-making in digital marketing.
- By effectively predicting conversions, marketers can optimize their strategies, improve campaign outcomes, and maximize return on investment.
- The ability to anticipate conversion rates allows for targeted adjustments to campaigns, enhancing overall marketing effectiveness.
